
 Friday May 8 saw the release of the most disastrous monthly jobs report in American economic history. In its monthly Employment Situation released last Friday, the U.S. Bureau of Labor Statistics reported:
- Payroll employment levels declined by 20.5 million between mid-March when the COVID-19 lockdowns began in earnest and mid-April—a decline that is more than two orders of magnitude greater than any previous monthly job loss in the U.S.
- The number of officially unemployed persons rose to a staggering 23.1 million in the mid-April measure, a three-fold increase from 7.1 million unemployed persons in mid-March.
- The number of Americans participating in the labor market fell by 6.4 million over the month, and the number of persons out of the labor force who said they wanted a job, but had quit looking, doubled over the month.
- About 5 million more workers were forced to work part-time schedules involuntary by mid-April; a doubling of individuals working part-time involuntarily.
- Average weekly earnings for private-sector workers rose from $977 to $1,026, attributable to a greater share of higher-wage workers among those who remain employed, as increasing numbers of low-wage and part-time workers have become unemployed, bearing the brunt of this downturn.
- The proportion of individuals in the labor force who face some kind of labor market trouble, such as unemployment, involuntary part-time employment or marginal attachment to the labor force, rose from 8.7% in mid-March to 22.8% by mid-April.
In this piece, we try to examine three issues for higher education institutions and students in New England. First, what is the magnitude of job losses in New England compared with the rest of the nation. Second, how have the shutdowns affected college graduates compared with those with fewer years of schooling, and what might this mean in the recovery. Third, what has been the impact of these losses on teens and young adults and what might that mean for decisions to continue in school.
New England job losses
The monthly business establishment survey conducted by the U.S. Bureau of Labor Statistics produces a measure of the total employment on business establishment payrolls in the week that includes the 12th of the month. Thus, the reported monthly employment measures are a snapshot of the number of jobs in the American economy at mid-month. The 20.5 million jobs lost between mid-March and mid-April, therefore, does not include the losses that occurred after the reference week of the business establishment survey; in the last two weeks of April and the beginning of May.
The lockdown began in mid-March and initial unemployment insurance (UI) claims over the next four weeks, through mid-April, totaled 21.8 million, suggesting a near 1:1 ratio of lost payroll jobs (20.5 million) and new UI claims filed (21.8 million). This is not surprising as individuals eligible for UI benefits must be laid off from a payroll job, and the payroll employment counts are benchmarked each year to state unemployment tax filings that count each tax payment on a social security account as a job. So, there is an inverse proportionate connection between trends in UI claims and payroll employment. During the three-week period between mid-April and the week ending May 2, an additional 11.4 million new UI claims were filed, suggesting that over that period, the country lost an additional 11.4 million jobs, bringing total job losses nationwide to about 33 million (seasonally adjusted) by the beginning of May.
In New England, the number of initial UI claims over the first seven weeks of the lockdown totaled 1.567 million (not seasonally adjusted). Total payroll employment in New England at the beginning of the lockdown was 7.52 million. The surge in initial UI claims and the inverse proportionate connection between UI claims and employment imply that payroll employment levels in the region declined by about 21% since the lockdown began; not far from the implied national employment decline of 20% of the pre-lockdown level of employment.
Most states in New England have similar implied levels of job losses measured with new UI claims as a share of pre-lockdown employment that are within a few percentage points of 20%. The exception is Rhode Island where more than 154,000 new UI claims were filed in the seven-week lockdown period, implying a 31% employment decline in the Ocean State.
These massive implied job losses mean dramatic declines in household incomes resulting in sharp reductions in the level of private consumption and investment. The demand for postsecondary education services is also expected to decline with these income losses. At the national level, the gross domestic product, a measure reflective of national income, in the second quarter of 2020 is expected to decline by a stunning and unprecedented annualized rate of more than one-third, according to research at the Federal Reserve Bank of Atlanta. Surveys of college-bound seniors about enrollment choices for the fall universally reflect worries about family income, according to polls of students conducted by the Art and Science Group, LLC, in March and April 2020.
Table 1: Total Number of Initial Unemployment Insurance Claims in the New England States over the Seven-Week Lockdown Period (not seasonally adjusted)
| Total Nonfarm Employment Mid-March 2020
(Pre-Lockdown) |
Flow of New Unemployment Insurance Claims, Over 7 weeks since the Lockdown | New Claims as a Share of Pre-Lockdown Employment | |
| Connecticut | 1,672,700 | 297,620 | 18% |
| Maine | 614,800 | 123,735 | 20% |
| Massachusetts | 3,631,500 | 778,186 | 21% |
| New Hampshire | 677,600 | 154,773 | 23% |
| Rhode Island | 493,200 | 154,388 | 31% |
| Vermont | 311,700 | 58,928 | 19% |
| New England | 7,401500 | 1,567,630 | 21% |
| U.S. Total | 150,583,000 | 30,503,295 | 20% |
Source: U.S Bureau of Labor Statistics, “The Employment Situation,” May 8, 2020 (https://www.bls.gov/news.release/pdf/empsit.pdf) and U.S. Department of Labor, Employment and Training Administration, “Unemployment Insurance Weekly Claims New Release” various weeks through May 7, 2020 (https://oui.doleta.gov/press/2020/050720.pdf).
College graduate employment
Every major industry in the U.S. posted substantial employment losses between mid-March and mid-April. However, job losses were especially concentrated in industries that employed workers with lower levels of educational attainment. Industries with large shares of professional technical and managerial occupations (“college labor market occupations”) had proportionally smaller employment declines.
Nationally, industries with large shares of employment in college labor market occupations, collectively lost about 3.7 million jobs between mid-March and mid-April, representing 6% of their pre-lockdown employment level. Industries that employ much higher shares of production, clerical and service workers saw their employment levels fall by about 16.4 million or 21% of their pre-lockdown employment level. These lower-skill and lower-wage industries accounted for about 80% of the overall employment decline in the U.S. between mid-March and Mid-April. Indeed, the leisure and hospitality industry saw employment decline by about 7.7 million, representing a 47% loss in one month. Eating and drinking establishments, hotels and amusement businesses sustained 40% of the nation’s total employment loss last month.
Table 2: Trends in Employment in the U.S. by Major Industry, Mid-March to Mid-April 2020
| Industries with 50% or Higher Shares of Employment in Professional Technical, Managerial (PTM) Occupations | ||||
| Industry | Mid-March 2020 | Mid-April
2020 |
Change | Percent Change |
| Information | 2,890 | 2,636 | -254 | -9% |
| Financial activities | 8,842 | 8,580 | -262 | -3% |
| Professional and Tech services | 9,702 | 9,194 | -508 | -5% |
| Management of Companies | 2,447 | 2,365 | -82 | -3% |
| Education (private only) | 3,791 | 3,334 | -457 | -12% |
| Health | 16,469 | 15,032 | -1,437 | -9% |
| Government | 22,717 | 21,737 | -980 | -4% |
| Total | 63,968 | 60,242 | -3,726 | -6% |
| Industries with Less Than 25% Shares of Employment in Professional, Technical and Managerial Occupations | ||||
| Industry | Mid-March 2020 | Mid-April 2020 | Change | Percent Change |
| Construction | 7,606 | 6,031 | -1,575 | -21% |
| Manufacturing | 12,818 | 11,488 | -1,330 | -10% |
| Wholesale Trade | 5,931 | 5,568 | -363 | -6% |
| Retail Trade | 15,627 | 13,520 | -2,107 | -13% |
| Transport and Wholesale | 5,670 | 5,086 | -584 | -10% |
| Administrative Support | 9,309 | 7,773 | -1,536 | -17% |
| Leisure and Hospitality | 16,368 | 8,715 | -7,653 | -47% |
| Other Services | 5,903 | 4,636 | -1,267 | -21% |
| Total | 79,232 | 62,817 | 16,415 | 21% |
Source: U.S Bureau of Labor Statistics, “The Employment Situation,” May 8, 2020 https://www.bls.gov/news.release/pdf/empsit.pdf
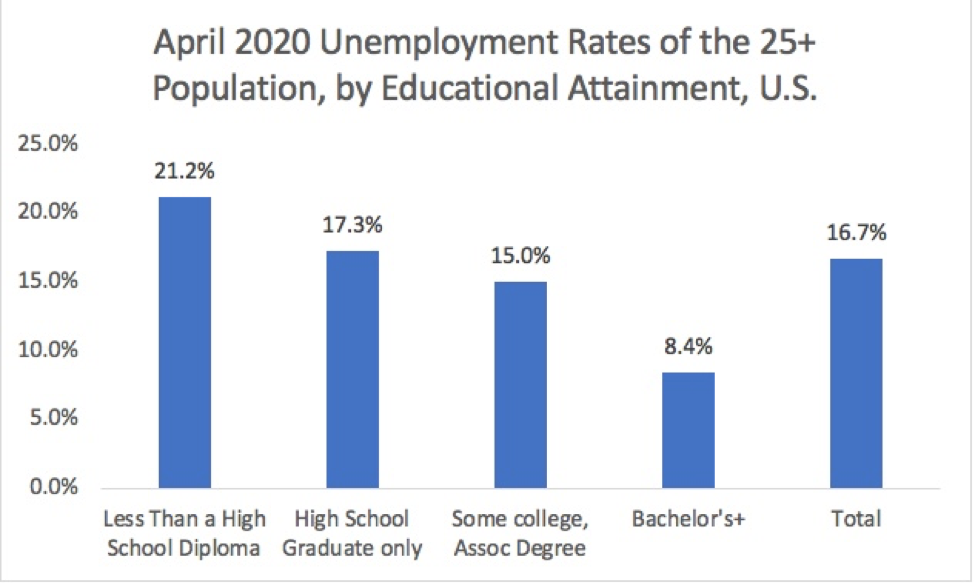
The disparate impacts of the lockdown across industries has meant that the employment declines among college graduates, although very large, have been much less severe than among people with fewer years of schooling. Employment among adult high school dropouts and graduates fell by 21% and 18%, respectively; a pace of loss that was 2.5 to 3 times greater than the 7% employment decline experienced by college graduates.
Table 3: Trends in Employment of Persons Aged 25 and Older in the U.S., by Level of Educational Attainment, Mid-March to Mid-April 2020
| Educational Attainment | Mid-March 2020 | Mid-April 2020 | Change | Percent Change |
| Less Than a High School Diploma | 8,626 | 6,774 | -1,852 | -21% |
| High School Graduate only | 33,667 | 27,505 | -6,162 | -18% |
| Some college, Assoc Degree | 36,013 | 30,485 | -5,528 | -15% |
| Bachelor’s+ | 59,000 | 55,084 | -3,916 | -7% |
| Total | 137,306 | 119,848 | -17,458 | -13% |
Source: U.S Bureau of Labor Statistics, “The Employment Situation,” May 8, 2020 (https://www.bls.gov/news.release/pdf/empsit.pdf)
The structure of April unemployment rates by educational attainment is reflective of the relative insulation that college graduates have had to the economic effects of the lockdown. The unemployment rate of adult college graduates of 8.4% was equal to just half that of all adult labor force participants in the U.S. This inequality in unemployment rates is likely to persist for some time as the work activities of college graduates seem to allow more geographic and temporal flexibility, primarily through telecommunications systems, than do the work requirements of those employed outside of the college labor market.
Source: U.S Bureau of Labor Statistics, “The Employment Situation,” May 8, 2020 (https://www.bls.gov/news.release/pdf/empsit.pdf).
Shrinking options for teens and young adults
The labor market for teens (16-19) and young adults (20-24) has collapsed in the past month. While employment levels fell by 13% for adults aged 25 or older, employment among younger people declined at more than double this pace. Employment among teens fell by nearly 1.6 million or 31% over the month, while employment among young adults declined by 3.4 million; a one-quarter reduction.
The employment rate of teens (share of teens with a job) plunged from 30% in mid-March to 21% in mid-April. The employment rates among young adults didn’t fare much better; declining from 64% to 48% between mid-March and mid-April.
Table 4: Trends in Teen and Young Adult Employment in the U.S., Mid-March to Mid-April 2020
| Age | Mid-March 2020 | Mid-April 2020 | Change | Percent Change |
| 16-24 | 18,481 | 13,503 | -4,978 | 27% |
| 16-19 | 5,054 | 3,479 | -1,575 | 31% |
| 20-24 | 13,427 | 10,024 | -3,403 | -25% |
| 25+ | 137,306 | 119,848 | -17,458 | -13% |
Source: U.S Bureau of Labor Statistics, “The Employment Situation,” May 8, 2020 (https://www.bls.gov/news.release/pdf/empsit.pdf)
Very large employment declines are typical of most labor market downturns, but the magnitude of these losses means that the option of work as a substitute for school has become much less viable for young people.
This also means that the foregone wages from working instead of going to school have fallen dramatically, implying that students will be giving up very little if they decide to go to school. The opportunity cost of college enrollment has been reduced to video chats in mom’s basement instead of employment and earnings.
Recovery in the teen and young adult labor market is likely to occur not months but years into the future. Unprecedented numbers of idle adult workers are anxious to get back to work, while young people remain at the bottom of the hiring queue. Therefore, until the large numbers of unemployed and underemployed adults, who are ahead in the hiring line-up, can get back to work, the employment outlook for teens and young adults remains especially poor.
We realize that this is a truly grim picture of the job market in New England and the nation. Those who believe that the economy should remain closed for an indefinite period—until we find a vaccine or even to the extreme of waiting until we eradicate the novel coronavirus—must understand the grim consequences of the choice to remain closed and the utter havoc it is unleashing on millions of households in New England and the U.S., as well as the irreparable harm that will be done to many of the businesses and institutions that employ them. We do not envy those who are charged with making difficult decisions about reopening, but the discussion above reveals some of extraordinary labor market costs associated with the shutdown strategy. College leadership around the region has begun to recognize this as indicated by a willingness in the last few weeks to undertake efforts to open more fully in the fall.
Decisions about reopening cannot be made solely on the widely varying measures of coronavirus spread. Many real, but unenumerated personal and social costs as well as explicit and implicit economic costs must be considered in the balance. Of particular importance is the unequal distribution of these economic and social costs that is, thus far, heavily weighted toward lower-income, poorly educated and racial and ethnic minority individuals and households.
Originally, when Dr. Anthony Fauci called for a 14-day shutdown in mid-March, the race against COVID-19 looked like a sprint with the reopening of the economy occurring all at once. The expectation was a V-shaped recovery from the coronavirus: a sharp decline and an equally sharp rebound. However, it has become increasingly clear that the race against the coronavirus is more akin to a marathon, and the economic activity at this point looks more like a modified letter L; with a sharp decline followed by a slow recovery.
We expect reopening of the economy to occur gradually and in fits and starts. As we learn more about the coronavirus, business and governments will adopt more refined policy responses to any additional coronavirus threats that occur during the reopening process. We expect reopening across most states to be designed to prioritize strict mitigation strategies to protect the elderly and at-risk populations and maintain many of the social-distancing efforts in play today. Businesses and government will develop and implement many creative measures to protect workers and consumers as they strive to establish a new normal of life-sustaining social and economic activity.
Neeta Fogg is research professor at the Center for Labor Markets and Policy at Drexel University. Paul Harrington is director of the center.
[ssba]
Thoughtful article. I miss you two.
So refreshing to see projections based on data and thoughtful analysis. I look forward to continuation of this work.
Well done. Looks like a long road ahead . I am sure you will both be very busy
Stay well, we need you