Updated August 2012
The enigmatic term “college readiness” is increasingly used in education and policy environments across the country. While school-university partnerships, school-community initiatives and state and federal legislation have shown promise in preparing students for college study, a common definition of the term remains elusive, and many students are still underprepared for college-level coursework. For its College Readiness figures, NEBHE continues to use commonly cited indicators of college readiness to provide one perspective on New England students’ preparation and interests in postsecondary education.
Recent data show:
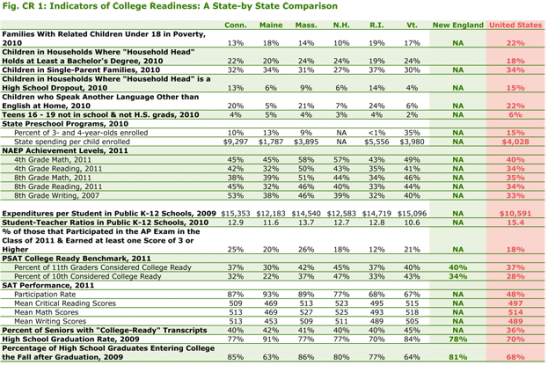
• Slightly over four in 10 high school seniors have “college-ready” transcripts across the New England states; even so, New England students on average perform above the national norm on various indicators of college readiness.
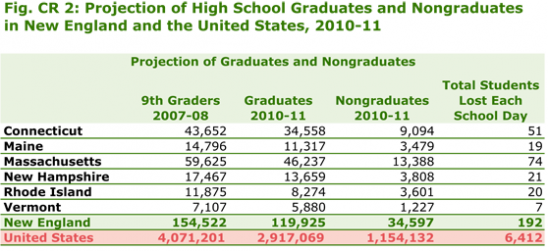
• Each school day, New England high schools “lose” 192 students.
Figure CR 1: Indicators of College Readiness: A State-by State Comparison
Click on the chart to enlarge.
Notes: New Hampshire has no distinct state preschool programs. NAEP Achievement Levels represent the percentage of students that scored proficient on the National Assessment of Educational Progress (NAEP) exams. In order to have a “College-Ready Transcript,” students must have taken at least four years of English, three years of math, and two years of natural science, social science and foreign language before graduating from high school. In the class of 2011, 18% of public high school graduates participated in AP and earned at least one AP Exam score of 3 or higher. The PSAT/NMSQT College Readiness Benchmark represents the score a student should meet or exceed to be considered on track to be college ready.
Sources: U.S. Census Bureau; National Institute for Early Education Research; Editorial Projects in Education Research Center; The College Board; National Center for Higher Education Management Systems; Kids Count / Annie E. Casey Foundation; National Assessment of Educational Progress (NAEP); The Manhattan Institute For more information on how college ready benchmarks were established a research report is available from The College Board, PSAT/NMSQT Indicators of College Readiness.
Figure CR 2: Projection of High School Graduates and Nongraduates in New England and the U.S., 2010-11
Click on the chart to enlarge.
Source: New England Board of Higher Education analysis of Editorial Project in Education (EPE) Research Center data, Diplomas Count 2011.
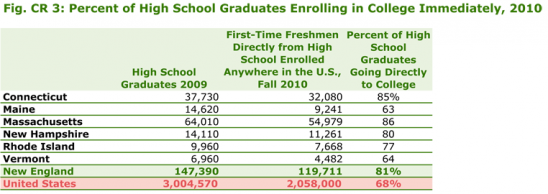
Figure CR 3: Percent of High School Graduates Enrolling in College Immediately, 2010
Click on the chart to enlarge.
Source: New England Board of Higher Education analysis of U.S. Department of Education data and National Center for Education Statistics data.
Figure CR 4: Migration of First-Time Freshmen to and from New England, 2010
Click on the chart to enlarge.
Source: New England Board of Higher Education analysis of U.S. Department of Education data.
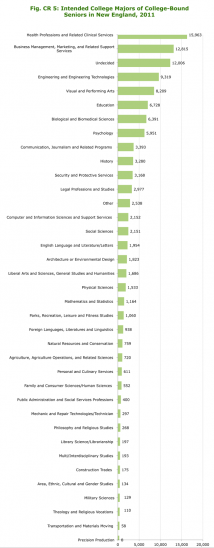
Figure CR 5: Intended College Majors of College-Bound Seniors in New England, 2011
Click on the chart to enlarge.
Source: The College Board.
[ssba]


