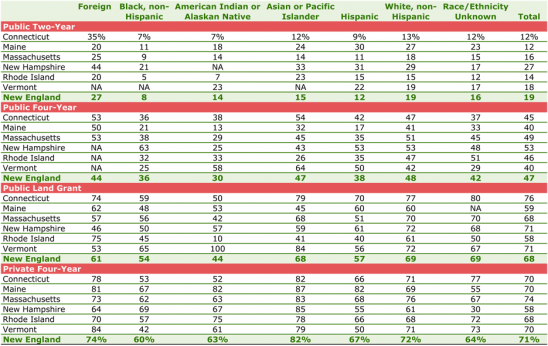
- Only 19% of students at New England’s traditionally two-year community colleges graduate within three years of enrolling—and the rate is even lower among minority groups.
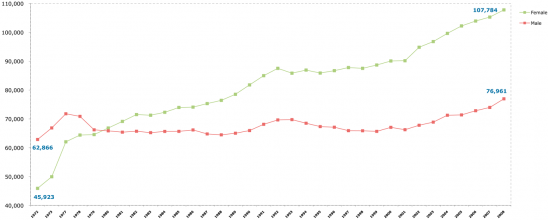
- Nearly 60% of all higher education degrees awarded in New England are conferred on women.
- More than one-quarter of doctorates awarded by New England universities go to foreign students, while fewer than two in 10 go to U.S. minority students.
Fig. 34: Graduation Rates by State/Race/Ethnicity and Type of Institution, 2008
Click on the chart to view it full size in a new window.
Note: The graduation rate is the percentage of students who complete an associate degree (at two-year institutions) within three years, or a bachelor’s degree (at four-year institutions) within six years.
Source: New England Board of Higher Education analysis of U.S. Department of Education data.
Fig. 35: Graduation and Transfer Rates by State and Type of Institution, 2008
Click on the chart to view it full size in a new window.
Note: The graduation rate is the percentage of students who complete an associate degree (at two-year institutions only) within three years or a bachelor’s degree (at four-year institutions) within six years. Figures are based on cohorts entering in 2002 (four-year institutions) or 2005 (two-year institutions). The New England figures are based on the aggregate numbers of all institutions of a given type, rather than an average of the states’ graduation rates.
Source: New England Board of Higher Education analysis of U.S. Department of Education data.
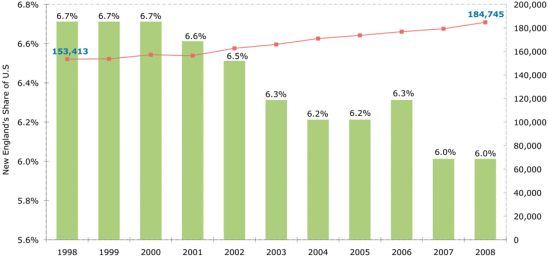
Fig. 36: Total Degrees Awarded at New England’s Colleges and Universities and New England’s Share of U.S. Degrees, 1998 to 2008
Click on the chart to view it full size in a new window.
Source: New England Board of Higher Education analysis of U.S. Department of Education data.
Fig. 37: Degrees Awarded in New England by Gender, 1972 to 2008
Click on the chart to view it full size in a new window.
Source: New England Board of Higher Education analysis of U.S. Department of Education data.
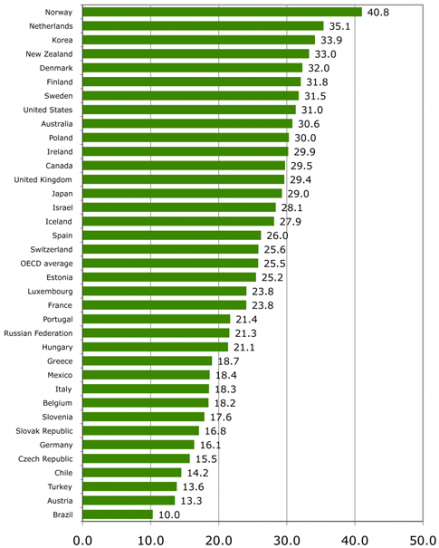
Fig. 38: Attainment of Tertiary-Type A Degrees, for 25- 34-Year-Olds in OECD and Partner Countries, 2008
Click on the chart to view it full size in a new window.
Note: Tertiary-type A programs are largely theory-based and designed to provide sufficient qualifications for entry to advanced research programs and roughly correspond to bachelor’s and master’s degree programs in the United States. Advanced research programs correspond to doctorate programs.
Source: Organization for Economic Co-operation and Development, Education at a Glance: OECD Indicators 2009, Table A1.3a.
Fig. 39: Associate Degrees Conferred on Men, Women, Minorities and Foreign Students, 2008
Click on the chart to view it full size in a new window.
Source: New England Board of Higher Education analysis of U.S. Department of Education data.
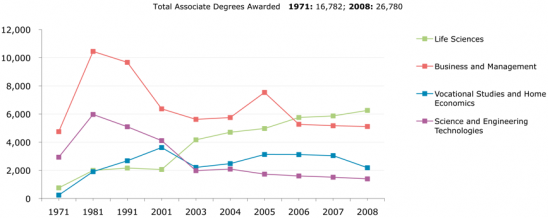
Fig. 40: Associate Degrees Awarded at New England Colleges and Universities by Selected Fields of Study, 1971 to 2008
Click on the chart to view it full size in a new window.
Notes: Data from 1971 to 2001 reflect 10-year intervals and data from 2003 to 2008 reflect one-year intervals. Disciplines not listed include: Arts and Music, Education, Social Service Professions, Communication and Librarianship, Engineering, Psychology, Social Sciences, Geosciences, Law, Interdisciplinary or other Sciences, Physical Sciences, Architecture and Environmental Design, Humanities, Religion and Theology, Math and Computer Sciences and unknown disciplines. These unlisted disciplines awarded 14,952 degrees in 2008.
Source: New England Board of Higher Education analysis of U.S. Department of Education data.
Fig. 41: Bachelor’s Degrees Conferred on Men, Women, Minorities and Foreign Students, 2008
Click on the chart to view it full size in a new window.
Source: New England Board of Higher Education analysis of U.S. Department of Education data.
Fig. 42: Bachelor’s Degrees Awarded at New England Colleges and Universities by Selected Field of Study, 1971 to 2008
Click on the chart to view it full size in a new window.
Note: Data from 1971 to 2001 reflect 10-year intervals and data from 2003 to 2008 reflect one-year intervals. Disciplines not listed include: Communication and Librarianship, Math and Computer Sciences, Engineering, Vocational Studies and Home Economics, Science and Engineering Technologies, Social Service Professions, Physical Sciences, Architecture and Environmental Design, Geosciences, Religion and Theology, Interdisciplinary or other Science, Law and unknown disciplines. These unlisted disciplines awarded 25,798 degrees in 2008.
Source: New England Board of Higher Education analysis of U.S. Department of Education data.
Fig. 43: Master’s Degrees Conferred on Men, Women, Minorities and Foreign Students, 2008
Click on the chart to view it full size in a new window.
Source: New England Board of Higher Education analysis of U.S. Department of Education data.
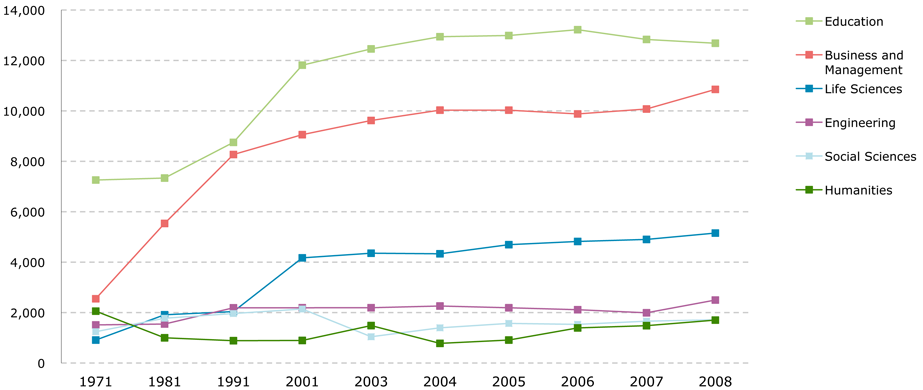
Fig. 44: Master’s Degrees Awarded at New England Colleges and Universities by Selected Fields of Study, 1971 to 2008
Click on the chart to view it full size in a new window.
Notes: Data from 1971 to 2001 reflect 10-year intervals and data from 2003 to 2008 reflect one-year intervals. Disciplines not listed include: Physcial Science, Geosciences, Math and Computer Science, Psychology, Science and Engineering Technologies, Interdisciplinary or other Sciences, Religion and Theology, Arts and Music, Architecture and Environmental Design, Communication and Librarianship, Law, Social Service Professions, Vocational Studies and Home Economics and unknown disciplines. These unlisted disciplines awarded 12,947 degrees in 2008.
Source: New England Board of Higher Education analysis of U.S. Department of Education data.
Fig. 45: First-Professional Degrees Conferred on Men, Women, Minorities and Foreign Students, 2008
Click on the chart to view it full size in a new window.
Note: 2008 is an optional year for institutions reporting First-Professional and Doctorate degrees. IPEDS is implementing new categories for the these programs.
Source: New England Board of Higher Education analysis of U.S. Department of Education data.
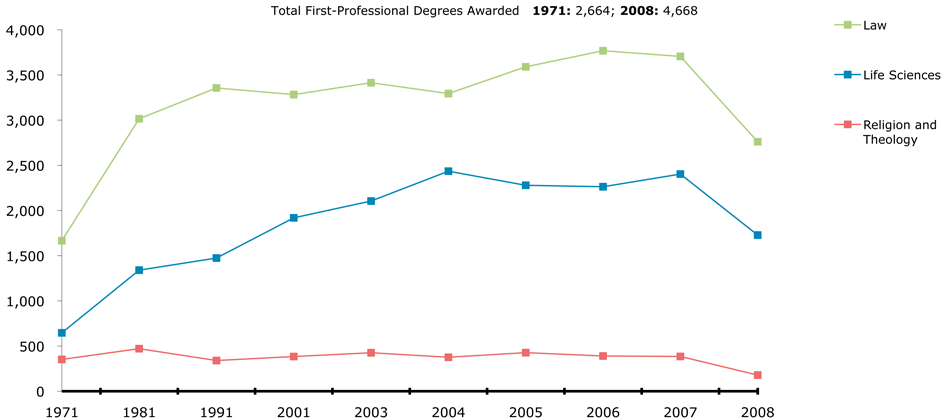
Fig. 46: First-Professional Degrees Awarded at New England Colleges and Universities by Field of Study, 1971 to 2008
Click on the chart to view it full size in a new window.
Note: 2008 is an optional year for institutions reporting First-Professional and Doctorate degrees. IPEDS is implementing new categories for these programs. Data from 1971 to 2001 reflect 10-year intervals and data from 2003 to 2008 reflect one-year intervals. 2008 is an optional year for institutions reporting First-Professional and Doctorate degrees. IPEDS is implementing new categories for these programs.
Source: New England Board of Higher Education analysis of U.S. Department of Education data.
Fig. 47: Doctorates Conferred on Men, Women, Minorities and Foreign Students, 2008
Click on the chart to view it full size in a new window.
Source: New England Board of Higher Education analysis of U.S. Department of Education data.
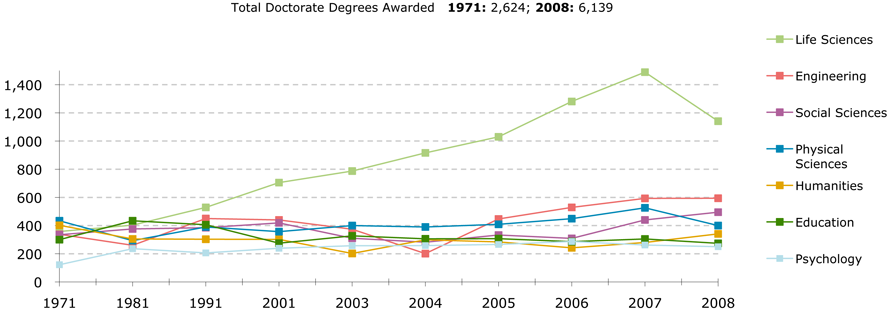
Fig. 48: Doctorates Awarded at New England Colleges and Universities by Selected Field of Study, 1971 to 2008
Click on the chart to view it full size in a new window.
Note: Disciplines not listed include: Geosciences, Math and Computer Science, Science and Engineering Technologies, Interdisciplinary or other Sciences, Religion and Theology, Arts and Music, Architecture and Environmental Design, Business and Management, Communication and Librarianship, Law, Social Service Professions, Vocational Studies and Home Economics and unknown disciplines. These unlisted disciplines awarded 3,495 doctorates in 2008.
Source: New England Board of Higher Education analysis of U.S. Department of Education data.
[ssba]

