Updated February 2012 …
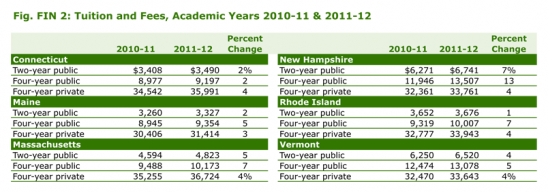
- New England’s public and private two-year and four-year colleges continue to be more expensive than the U.S. averages.
- The region continues to hold the dubious distinction of America’s lowest state appropriations for higher education and highest tuitions and fees for public colleges and universities.
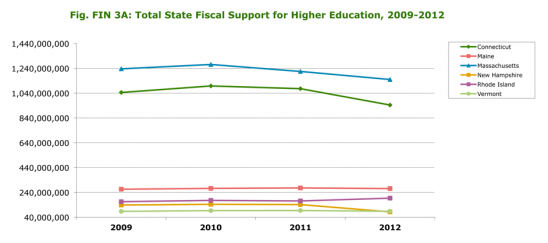
- Recent data from the annual Grapevine survey by the Illinois State University’s Center for the Study of Education Policy and the State Higher Education Executive Officers show state funding of higher ed grew by 2% in Connecticut and Vermont between FY07 and FY12, and by 5% in Maine. But funding declined during the period by -8% in Massachusetts, -33% in New Hampshire, and -17% in Rhode Island.
- In January 2012, the Obama administration issued plans for reforming higher ed financing. Among other things, the president’s plan would shift funds for so-called “campus-based” student aid programs (including need-based Perkins Loans with their 5% interest rates, and work-study) away from colleges with rising tuition and toward those that have “responsible tuition policy” and ensure that low-income students graduate. Historically, these programs had benefited New England disproportionately because funding was based partly on how long a college had taken part in the program.
Figure FIN 1: Average Student Expenses, New England vs. United States, Academic Year 2011-12
Click on the chart to enlarge in a new window.
Note: Room & board costs for commuter students are average estimated living expenses for students living off-campus but not with parents.
Source: Table 6, Average Student Expenses, by College Board Region, 2011-2012 (Enrollment-Weighted). Trends in College Pricing 2011, (2011); 11. Copyright © 2011 College Entrance Examination Board. Reprinted with permission. All rights reserved.
Figure FIN 2: Tuition and Fees, Academic Years 2010-11 & 2011-12
Click on the chart to enlarge in a new window.
Note: Figures for public institutions show rates for state residents. All data are enrollment-weighted averages, intended to reflect the average costs that students face in various types of institutions.
Source: Table 6c, Tuition and Fees by Region and Institution Type, in Current Dollars, 2011-2012 (Enrollment-Weighted). Trends in College Pricing 2011, (2011); 14. Copyright © 2011 College Entrance Examination Board. Reprinted with permission. All rights reserved.
Figure FIN 3: State Fiscal Support for Higher Education by State, and National Aggregate Local Tax Support for Higher Education, FY 2011 and FY 2012
Click on the chart to enlarge in a new window.
Note: Fiscal 2012 figures on state support for higher education represent initial allocations and estimates reported by the states and are subject to change. Note: Fiscal 2012 figures on state support for higher education represent initial allocations and estimates reported by the states and are subject to change. Federal stimulus stabilzation funds include funds used to restore the level of state support for public higher education. Federal stimulus government services funds exclude funds used for modernization, renovation or repair.
Source: New England Board of Higher Education analysis of data from Illinois State University Center for Higher Education and Education Finance.
Figure FIN 3A: Total State Fiscal Support for Higher Education, 2009-2012
Click on the chart to enlarge in a new window.
Source: New England Board of Higher Education analysis of data from Illinois State University Center for Higher Education and Education Finance.
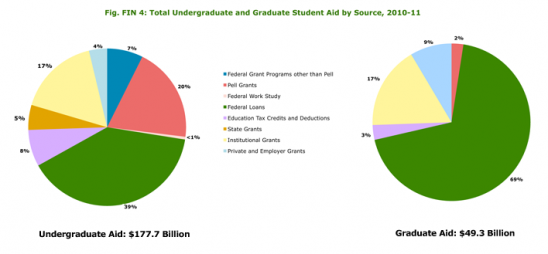
Figure FIN 4: Total Undergraduate and Graduate Student Aid by Source, 2010-11
Click on the chart to enlarge in a new window.
Source: Trends in Student Aid. Copyright ©2011 The College Board. All rights reserved.
Figure FIN 5: Federal Student Financial Aid Programs: Total Expenditures or Allocations and Number of Recipients
Click on the chart to enlarge in a new window.
Note: Spending on federal campus-based programs is reported as 2011-12 allocations. Spending on Pell Grants is reported as 2009-10 expenditures.
* Level of Expenditure (LOE): A school must request and have approved for each award year an LOE authorization that represents the maximum amount it may expend from its revolving Federal Perkins Loan fund.
Source: New England Board of Higher Education analysis of U.S. Department of Education data.
Figure FIN 6: Total State Grant Aid Awarded: 1999-00, 2004-05, 2008-09, 2009-10
Click on the chart to enlarge in a new window.
Note: Figures may not include aid funds provided through entities other than the principal state student aid agency.
Source: National Association of State Student Grant and Aid Programs.
Figure FIN 7: State Need-Based Aid as a Percentage of Federal Pell Grant Aid, 2010
Click on the chart to enlarge in a new window.
Source: New England Board of Higher Education analysis of data from National Association of State Student Grant and Aid Programs and U.S. Department of Education data.
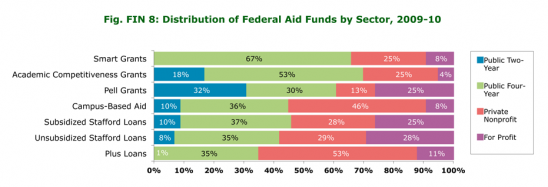
Figure FIN 8: Distribution of Federal Aid Funds by Sector, 2009-10
Click on the chart to enlarge in a new window.
Note: The figures reported here reflect total student aid amounts divided across all students, including non-recipients. Total aid includes Federal Work-Study and Education Tax Benefits. Loan numbers do not include private non-federal loans, which provide funding for students but do not involve subsidies.
Source: New England Board of Higher Education analysis of College Board data.
Figure FIN 9: Average Student Debt and Percent of Students with Debt, Class of 2010
Click on the chart to enlarge in a new window.
Source: New England Board of Higher Education analysis of data from the Project on Student Debt.
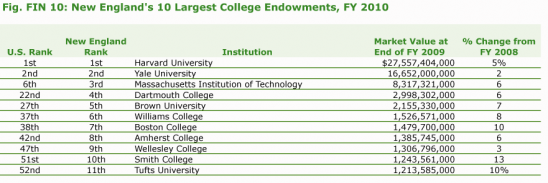
Figure FIN 10: New England’s 10 Largest College Endowments, FY 2010
Click on the chart to enlarge in a new window.
Note: Data for FY 2011 will be posted as it becomes available in late February 2012.
Source: New England Board of Higher Education analysis of 2010 National Association of College and University Business Officers Endowment Study.
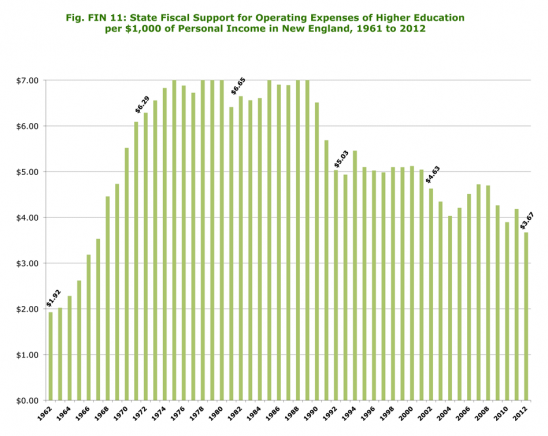
Figure FIN 11: State Fiscal Support for Operating Expenses of Higher Education
per $1,000 of Personal Income in New England, 1961 to 2012
Click on the chart to enlarge in a new window.
Source: New England Board of Higher Education analysis of data from Illinois State University Center for Higher Education and Education Finance.
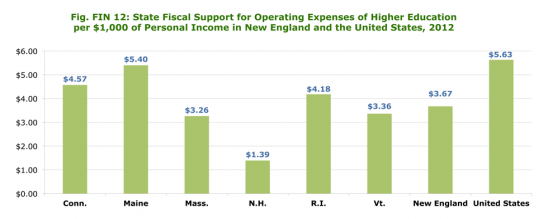
Figure FIN 12: State Fiscal Support for Operating Expenses of Higher Education
per $1,000 of Personal Income in New England and the United States, 2012
Click on the chart to enlarge in a new window.
Source: New England Board of Higher Education analysis of data from Illinois State University Center for Higher Education and Education Finance.
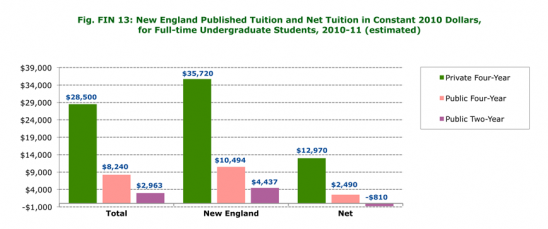
Figure FIN 13: New England Published Tuition and Net Tuition in Constant 2010 Dollars, for Full-time Undergraduate Students, 2010-11 (estimated)
Click on the chart to enlarge in a new window.
Note: Numbers are rounded to the nearest $10. Net tuition and fees are calculated by subtracting estimated average grant aid plus tax benefits per full-time student in the sector from the published price. Aggregate aid amounts are from Trends in Student Aid 2011. Division of total aid across sectors and between full-time and part-time students is based on the NPSAS, 1994 through 2009.
Source: New England Board of Higher Education analysis of College Board data.
[ssba]


