Updated December 2011 …
Since NEBHE began publishing tables and charts exploring “Trends & Indicators” in New England higher education more than a half-century ago, few figures have grabbed as much attention as college enrollment data. These local, state, regional and national data go beyond simple headcounts of students going to college to tell the stories of New England’s changing demography, the region’s economic life and increasing globalization.
There is no typical New England college student. The region’s student body—nearly 1 million strong—is more female than it used to be and increasingly multicultural. But the student body is hardly economically diverse. Of students born into the top quartile of family income, more than 84% graduate from high school and go on to college, compared with 41% of students from the bottom family income quartile, according to Postsecondary Education Opportunity, the data-rich newsletter published by higher education analyst Thomas G. Mortenson.
Among other findings:
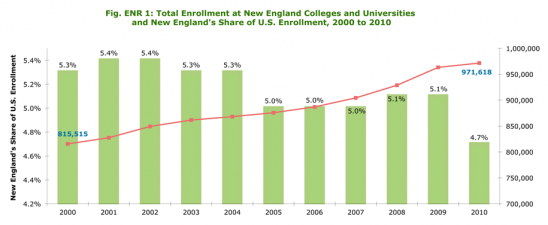
- More than 970,000 students were enrolled at New England’s colleges and universities in 2010, up by more than 150,000 students since 2000.
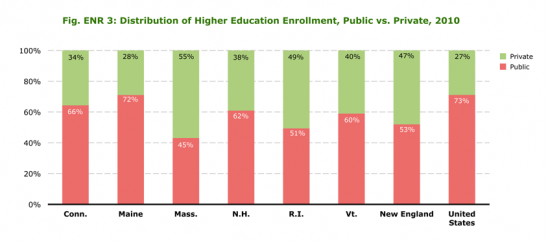
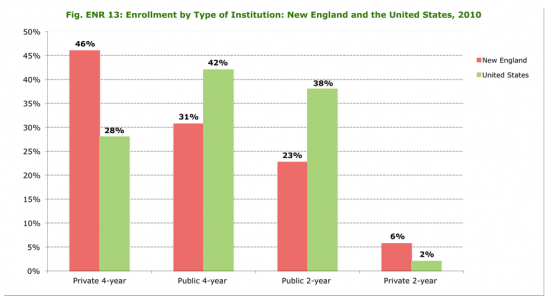
- Nearly half of New England college students attend private institutions, compared with just over one-quarter nationally.
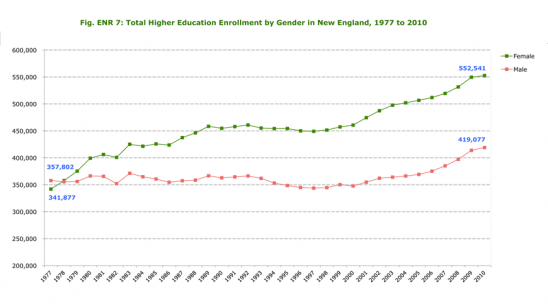
- Women students began to outnumber men on New England college and university campuses in 1978, and the imbalance has grown to about 542,000 women to 419,000 men.
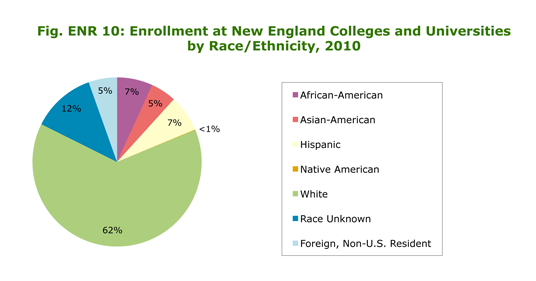
- The number of Hispanic college students has doubled in New England since 2000. Yet Hispanics and African-Americans together still account for only 14% of New England college students.
Figure ENR 1: Total Enrollment at New England Colleges and Universities and New England’s Share of U.S. Enrollment, 2000 to 2010
Click on the chart to enlarge.
Source: New England Board of Higher Education analysis of U.S. Department of Education data.
Figure ENR 2: Higher Education Enrollment in New England by Type of Institution and Full-Time Status, 2010
Click on the chart to enlarge.
Note: U.S. totals are projected by the U.S. Department of Education. Full-time and part-time breakdowns for public and private institutions were not available.
Source: New England Board of Higher Education analysis of U.S. Department of Education data.
Figure ENR 3: Distribution of Higher Education Enrollment, Public vs. Private, 2010
Click on the chart to enlarge.
Source: New England Board of Higher Education analysis of U.S. Department of Education data.
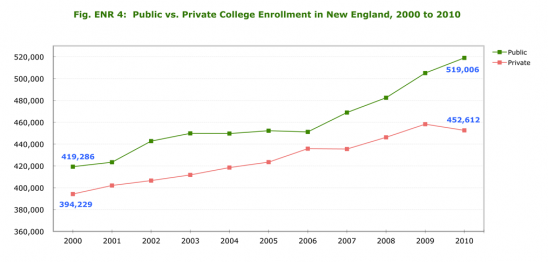
Figure ENR 4: Public vs. Private College Enrollment in New England, 2000 to 2010
Click on the chart to enlarge.
Source: New England Board of Higher Education analysis of U.S. Department of Education data.
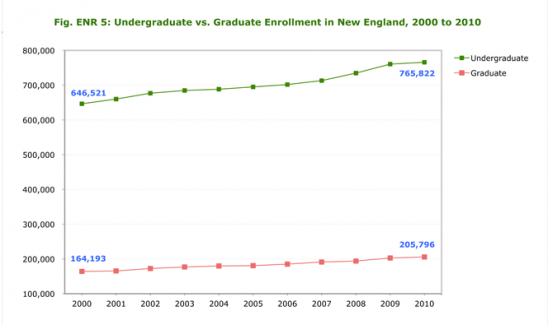
Figure ENR 5: Undergraduate vs. Graduate Enrollment in New England, 2000 to 2010
Click on the chart to enlarge.
Source: New England Board of Higher Education analysis of U.S. Department of Education data.
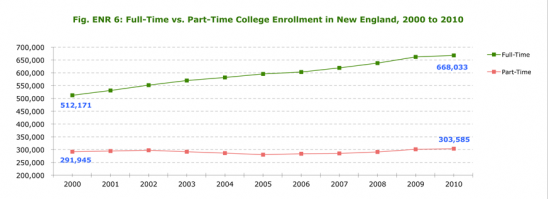
Figure ENR 6: Full-Time vs. Part-Time College Enrollment in New England, 2000 to 2010
Click on the chart to enlarge.
Source: New England Board of Higher Education analysis of U.S. Department of Education data.
Figure ENR 7: Total Higher Education Enrollment by Gender in New England, 1977 to 2010
Click on the chart to enlarge.
Source: New England Board of Higher Education analysis of U.S. Department of Education data.
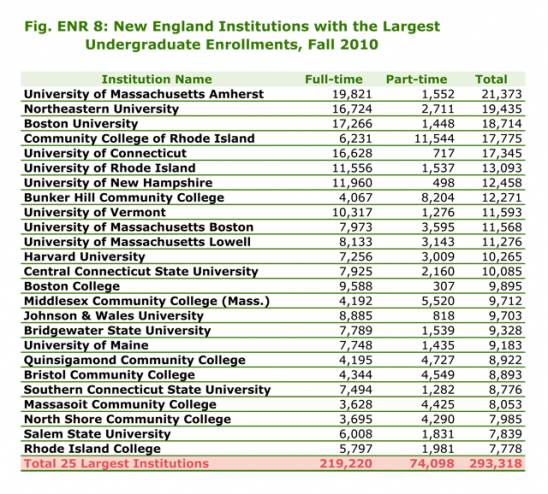
Figure ENR 8: New England Institutions with the Largest Undergraduate Enrollments, Fall 2010
Click on the chart to enlarge.
Source: New England Board of Higher Education analysis of U.S. Department of Education data.
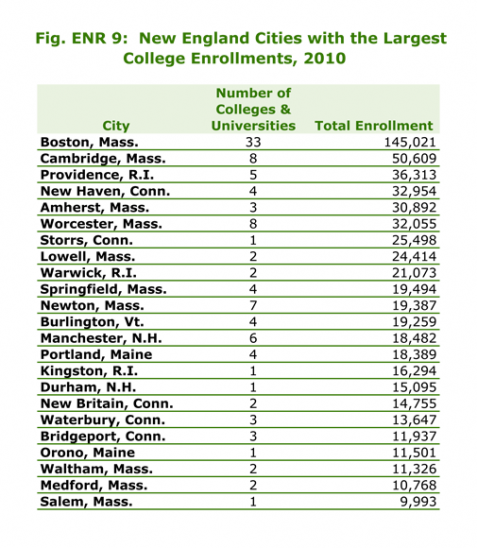
Figure ENR 9: New England Cities with the Largest College Enrollments, 2010
Click on the chart to enlarge.
Note: Total enrollment includes full-and part-time undergraduate, graduate and non-degree students.
Source: New England Board of Higher Education analysis of U.S. Department of Education data.
Figure ENR 10: Enrollment at New England Colleges and Universities by Race/Ethnicity, 2010
Click on the chart to enlarge.
Source: New England Board of Higher Education analysis of U.S. Department of Education data.
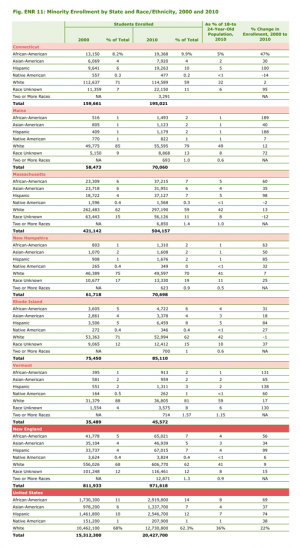
Figure ENR 11: Minority Enrollment by State and Race/Ethnicity, 2000 and 2010
Click on the chart to enlarge.
Source: New England Board of Higher Education analysis of U.S. Department of Education data.
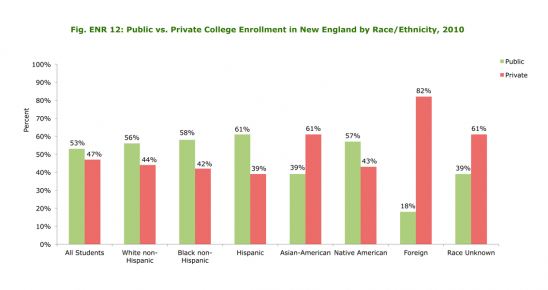
Figure ENR 12: Public vs. Private College Enrollment in New England by Race/Ethnicity, 2010
Click on the chart to enlarge.
Source: New England Board of Higher Education analysis of U.S. Department of Education data.
Figure ENR 13: Enrollment by Type of Institution: New England and the United States, 2010
Click on the chart to enlarge.
Source: New England Board of Higher Education analysis of U.S. Department of Education data.
[ssba]

