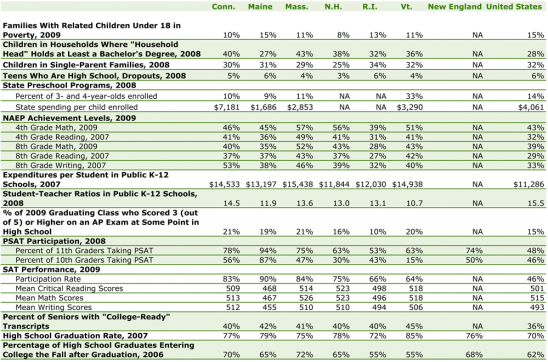
- Fewer than half of New England students who finish high school have completed the necessary courses and mastered the skills to be considered “college ready.” But New England states perform above the national norm on most indicators of college readiness.
- In Massachusetts, a new “Vision Project” has five goals: increase the rate of high school graduates who attend college; increase the graduation and success rates at colleges; align degree programs with needs of businesses; become the national leader in academic achievements; and ensure that minority, poor and male and female students have comparable grades and graduation rates.
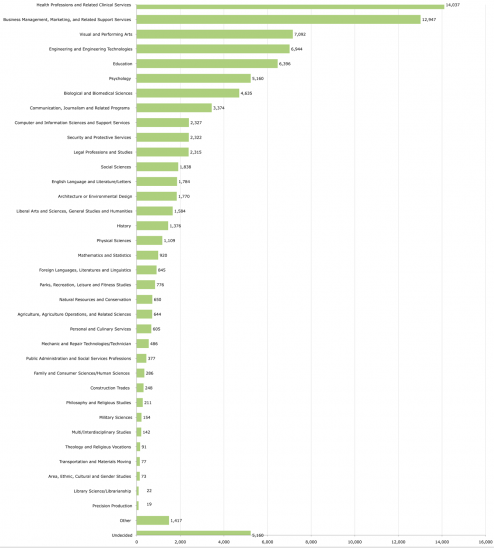
- Most college-bound high school seniors in New England name health or business fields as their intended college majors.
- The number of high school students declaring an interest in business fields has been declining since 2000, and has plunged in the past 18 months along with the perception of business professions during the nation’s deep recession, according to the National Research Center for College & University Admissions.
Fig. 12: Indicators of College Readiness: A State-by-State Comparison
Click on the chart to view it full size in a new window.
Notes: For Maine, preschool data refer to 4-year-olds only; New Hampshire and Rhode Island have no distinct state preschool programs. NAEP Achievement Levels represent the percentage of students that scored proficient on the National Assessment of Educational Progress (NAEP) exams. In order to have a “College-Ready Transcript” students must have taken at least four years of English, three years of math, and two years of natural science, social science and foreign language before graduating from high school.
Sources: U.S. Census Bureau, National Institute for Early Education Research, Editorial Projects in Education Research Center, The College Board, National Center for Higher Education Management Systems, Kids Count, Annie E. Casey Foundation, National Assessment of Educational Progress (NAEP), Manhattan Institute.
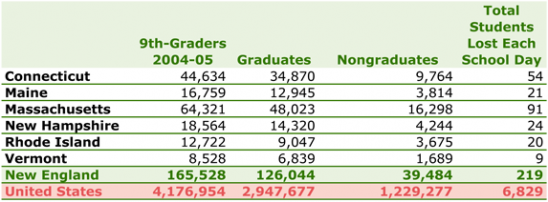
Fig. 13: Projection of High School Graduates and Non-graduates in New England and the United States
Click on the chart to view it full size in a new window.
Source: New England Board of Higher Education analysis of Editorial Project in Education (EPE) Research Center data, Diplomas Count 2008.
Fig. 14: Percent of High School Graduates Enrolled in College the Fall after Graduating High School, 2008
Click on the chart to view it full size in a new window.
Source: New England Board of Higher Education analysis of National Center for Higher Education Management Systems data.
Fig. 15: Migration of First-Time Freshmen to and from New England, 2008
Click on the chart to view it full size in a new window.
Note: 2007 was a voluntary reporting year for institutions reporting on migration; 2008 is a mandatory reporting year which may result in greater totals.
Source: New England Board of Higher Education analysis of U.S. Department of Education data.
Fig. 16: Intended College Majors of College-Bound Seniors in New England, 2009
Click on the chart to view it full size in a new window.
Source: The College Board.
[ssba]


